


The King is Dead...Long Live the King
Growth shudders as the Federal Reserve Tightens Financial Conditions


The Beatings Will Continue Until Morale Improves (Part Deux):
In our last issue (The Beatings Will Continue Until Morale Improves - April 28, 2022), we noted that as the Federal Reserve began tightening financial conditions global markets would begin to shudder. Specifically, we noted:
Inflation Expectations: The primary driver of Federal Reserve policy is inflation and inflation had increasingly become entrenched.
Pace of Rate Increases: The Fed would likely have to accelerate the pace of hiking to respond to inflation.
Pace of Balance Sheet Run-off: There was still a great deal of uncertainty surrounding the Federal Reserve’s balance sheet that would significantly impact the long-end (and risk assets).
Recession: Accelerating the pace of hiking to respond to inflation (by slowing growth and increasing unemployment) nearly ensured a recession.
Corporate Credit Spreads, Housing Activity and Repo Markets: Raising rates into a slowing economy was almost certain to cause market distress. In particular, rate risk in the corporate bond market and MBS had the potential to bleed through to corporate and housing activity. We also noted that repo markets had the potential to cause funding issues as liquidity diminished.
Distress in Emerging Markets: As the Federal Reserve tightened monetary policy, all countries with large US dollar needs (nearly all of the world) would tighten involuntarily as well. Deleterious effects of Federal Reserve tightening in these nations would cause pressure in the FX markets.
As the months have progressed, we have seen these 6 observations unfold in real-time:
First, since our last edition on April 28th, CPI has accelerated. Most notably for the period ended in June 2022, headline CPI came in at 9.1% (June 2022 CPI) representing the largest 12-month increase since 1981. Ex-food & energy came in at 5.9% (with food and energy increasing at rates of 10.4% and 41.6% respectfully). “Sticky-CPI” (a subset of goods and services that change infrequently and therefore are believed to more accurately reflect forward expectations of inflation) came in at 5.43% (more than double the 2% long-term average inflation target of the Federal Reserve) (Sticky CPI - FRED).
Second, as inflation began to entrench, the Fed accelerated its pace of hiking. At the June 15th FOMC meeting the Federal Reserve accelerated the pace of hiking from 50bps to 75bps (allegedly leaking the expected hike to the press through a WSJ reporter during the Federal Reserve “black-out” period in an effort to get ahead of an unexpectedly high CPI reading in June) (Bad Inflation Reports Raise Odds of Surprise 0.75-percentage point rate rise this week). At the July 27th FOMC meeting, the Federal Reserve followed up with an additional 75bp hike in the July 27th FOMC meeting (bringing the policy rate up to 2.25-2.50%).
Third, quantitative tightening by the Fed officially began on June 1st (and effectively began on June 15th). The effect on the long-end of the curve has been fairly muted to date, however, it should be noted that the Balance Sheet has yet to materially decline (owing to a ramp period and scheduled purchases rolling off). This should change in the fall assuming the Fed stays the course with the announced pace of run-off (Fed Balance Sheet - Total Assets).
Fourth, as the Federal Reserve has begun tightening, growth has begun to sputter around the world. Notably layoffs have accelerated (particularly in the high multiple tech sector and VC-subsidized markets) and growth slowed to -0.9% in Q2 (resulting in a technical recession). A slow-down in the pace of hiring in banking and legal markets has also been rumored (although the unemployment rate has remained historically low).
Fifth, raising rates into a slowing economy has substantially slowed market activity. MBS went bid-less and housing activity severely slumped off beginning in June. Credit has begun to reprice (particularly in BBB and HY). Notably, spreads have stayed tight while significant losses have been imposed as increases in rates caused repricing. Notably, repo (and funding markets generally) have stayed relatively calm (ensuring the Fed can continue to hike more).
Sixth, emerging markets, the Eurozone and Japan have endured significant distress causing the BOJ to effectively adopt yield curve control (YCC) and the ECB to announce a future “Transmission Protection Instrument” (TPI) (i.e. the ECB has adopted an “acceptable spread” over which bonds of struggling Eurozone members will be purchased to bring the spread back within an acceptable target range; this is to be done without expanding the ECB balance sheet, but if the balance sheet were to expand this would also effectively amount to YCC). Seeking to protecting bond markets in this way has caused significant devaluing of their respective currencies.
The King is Dead…Long Live the King:
“Reports Of My Death Have Been Greatly Exaggerated”
- (misattributed to) Mark Twain
As inflation accelerated in late 2021 and early 2022, a steady chorus of market participants began screaming for the demise of the US Dollar (and US economic dominance around the world via hyperinflation and/or a new “Bretton Woods” moment). As we have seen over the past year, however, these proclamations of the imminent death of “King” Dollar (and America’s standing throughout the world) were greatly exaggerated.
As the Federal Reserve has tightened financial conditions, the US dollar’s international standing has strengthened (despite domestic inflation where it has weakened compared to goods) and the international strength of the USD has caused significant distress throughout the globe. Notably, the Dollar Index (DXY) increased ~20% since the beginning of the year forcing certain technology companies who took BTC on to their corporate balance sheets to “protect” against hyperinflation of the US dollar (to much fanfare) to sell down these holdings this quarter (Tesla Converts 75% of Bitcoin purchases to Fiat Currency). The narrative that BTC/crypto is a hedge against inflation has also largely died. Gold-bugs expounding on the imminent collapse of the US dollar have also quieted as gold suffered a ~15% drawdown since our April edition.
Simultaneous with this dollar strength, an energy crisis (and potential food crisis) has emerged, as the West and Russia redraw the map of oil and natural gas supply by way of second order effect of the ongoing conflict in the Ukraine. This shortage of oil and natural gas delivery is critically important heading into the winter months in Europe (where many nations rely on Russian oil). Oil (specifically diesel) is also a critical input component of most manufacturing and farming activity throughout the world, which has left many nations squeezed between the physical/commodities world (the BRIC nations) and the debt-financialization world (the Anglosphere, primarily the U.S.A. as the reserve currency).
The combination of USD strength and a worldwide energy shortage has been felt acutely in Japan and the Eurozone. This is particularly evident in the FX markets where the Euro fell to parity and the Japanese Yen devalued to >130 per USD as both areas of the globe struggle to maintain sovereign bond buying programs and to meet energy needs.
And yet, as bad as things might be in Europe and Japan, the effect of dollar strength is most pronounced in emerging markets where the IMF has warned of imminent debt crises in countries squeezed between USD-denominated debt and energy/food needs (IMF chief warns of debt crisis as higher rates follow covid/war). Bloomberg has also begun tracking nations for Sovereign Debt Vulnerability (Countries with the Highest Default Risk in 2022):

Notably, Sri Lanka defaulted in late May and riots stemming from food and energy shortages have begun throughout the emerging world (notably in Panama, Indonesia, Pakistan, Peru and Lebanon, among others). Europe has also seen civil unrest (particularly related to new farming regulations to reduce nitrogen use and higher fuel costs) in Holland, Spain, Poland, Italy (Farmers in Spain join Italy, Poland and Netherlands in mass European protests).
To be clear, it is safe to assume that the US did not have the express goal of killing the economies of emerging markets, Japan or the Eurozone, but when faced with domestic inflation had little option but to deal with problems at home and hope for the best abroad (as discussed in “Triffin’s Paradox” in our prior issue - The Beatings Will Continue Until Morale Improves). To quell domestic inflation via rate hikes, the foreseeable second order effect of reserve currency strength against a backdrop of stagnant global growth and high US dollar denominated debt loads was almost certainly strife. Food and energy shortages make this situation considerably worse.
Yet, with ~9% CPI and a stubbornly tight labor market, the Fed is left with little choice but to continue tightening financial conditions in an effort to reign in its domestic economy (even as the rest of the world breaks around it).
Ultimately, however, the developed world is not immune to these effects (although it does operate on a delay). As growth around the world begins to slow, the consequences of Triffin’s paradox boomerang back to the reserve currency’s shores. That consequence takes the form of “recession”. That is to say, scarring emerging market economies has implications for the developed world.
The result of scarring is that the US dollar will reach a point at which it fails of its own strength. Or said another way, the US dollar will trade higher until declining global growth becomes so severe, shrinking growth (recession) begins to affect its strength (this is sometimes also associated with a credit event). In essence, declining growth around the world will blow back into US economic activity.
Initially, the relief from this “dollar-wrecking ball” presents as a positive. That is to say, as the USD weakens against other currencies, it stops strangling those affected foreign economies. This has the potential to cause risk-assets to rally (even into an underlying weakening economy) since it loosens financial conditions (which is a beneficial to risk).
However, this relief is typically short-lived. That is to say, historically, any such rally has a tendency to continue until the impact of credit contraction and slowing growth overtakes the temporary relief of “easing”, at which point, this “relief trade” turns to lower asset prices. This process does, however, take a fair bit of time to play-out and could last well into year-end (which may represent an opportunity for shorter-term traders and certain investors).
A Note on Earnings:
One of the ways a “relief rally” manifests itself is through earnings (and earnings estimates). When an economy is growing at a healthy pace earnings estimates reflect a level of expected growth that reflects that pace. When an economy becomes overheated, these expected levels of growth become unsustainable (but for a time are denied by most as being acceptable). As inflation begins to eat into input costs (and, via associated rate hikes, raise financing costs), earnings estimates begin to be downgraded (typically resulting in an asset price sell-off). Depending on how severe these downgrades are they sometimes open up room for “upside” surprises; where market participants begin to believe that the worst is behind them and that a “new normal” has been achieved (risk-assets sometimes rally off such conditions). However, after this “relief”, the proverbial “bottom” tends to fall out as earnings estimates have to be revised to reflect declining growth (in this case most likely declining global growth or global recession) at which point a true repricing of earnings occurs to reflect the decline in growth. This effect is sometimes visually demonstrated in a simplified form as shown below:

The observant reader will notice a similar pattern emerging in the S&P500:

A Note on Volatility in Rates:
It should also be noted that as recession (and recession fears) cause the dollar (and long-end rates) to reprice (i.e. fall), it has the simultaneous effect of loosening financial conditions (i.e. easing the effects of the “dollar wrecking ball”). Loosening financial conditions into an inflationary environment causes inflation expectations to rise. Which creates a “stop-go” feedback mechanism the Federal Reserve will most likely (and should be) eager to avoid.
In a small way, this can be seen readily by looking at the movements in risk and inflation swaps following the July 27th FOMC meeting. Following remarks that were interpreted as dovish, the dollar weakened, long rates fell and risk rallied. When this occurred inflation expectations also flared up >3% in a day (July 28th).
Rising inflation expectations is detrimental to the Fed’s price stability goal (which relies on achieving a long-run 2% average). As a result, as inflation expectations rise, the Federal Reserve needs to react more aggressively. Acting aggressively, tightens financial conditions, causing dollar strength, the “dollar wrecking ball” and deeper recession. The effect of recession causes financial conditions to loosen (as the dollar loses strength), which causes inflation expectations to rise. As you can intuit this circular feedback mechanism causes a great deal of volatility as financial conditions waffle between marginal changes in financial conditions. (For a historical example, people often forget that Paul Volcker—the hero of inflation/interest rate policy—actually caused 2 recessions in order to get inflation back under control. First he raised rates aggressively causing recession, then he paused—which loosened conditions and presumably saved the economy from deep scarring—and then he hiked again causing a second recession to break inflation once and for all).
It appears from Powell’s words at the July 27th FOMC meeting that the Federal Reserve recognizes this lesson of history. They have caused rates to rise to a level they believe is “neutral”. From here, they believe that they will need to raise further into a “moderately restrictive” stance to mitigate inflation.
From that point on, the Federal Reserve will need to act in a manner that is “data-dependent”, which is to say, they will need to moderate policy (specifically financial conditions) between inflation expectations and growth deterioration.
To accomplish this, the Federal Reserve may seek to use their “dot-plot” or “Summary of Economic Projections” (SEP) to dictate expectations of future hikes and the length of time for which those hikes will be maintained. The futures/forwards curves inevitably react to these projections as they price in a “terminal rate” and length. Similarly, by communicating that the Federal Reserve is “data-dependent”, the Federal Reserve introduces rates volatility. As futures/forwards curves react to labor force strength, wage growth and CPI prints to “auto-tighten” in real time (without Federal Reserve action—although the Federal Reserve will need to ratify certain price trends depending on price trends in inflationary goods like oil and food, as well as labor market tightness). This volatility is somewhat helpful in managing inflation, but can be a bit jarring for investors and traders.
A Note on Tightening:
Despite headline focus on interest rate hikes, it is also important to note that the Fed’s “quantitative tightening” program has yet to fully ramp. While quantitative tightening by the Fed officially began on June 1st (and effectively began on June 15th). The Balance Sheet has yet to materially decline or trend down (owing to a ramp period and scheduled purchases rolling off it has been in a neutral trend for the last few months). This should change in the fall assuming the Fed stays the course with the announced pace of run-off and it should begin trending down. This represents a headwind to risk (particularly long-duration risk and the long-end of the treasury curve) as the treasury market is forced to absorb supply without the assistance of Federal Reserve purchases.

It should also be noted that while quantitative tightening is superficially a liquidity/supply & demand story (specifically the supply of treasuries and agency-MBS), it is also implicitly a growth story (since marginal increases to the supply of MBS, correspondingly increase MBS spreads, which affect borrowing rates, which affect housing prices).
As a result (and analogous to the discussion above on earnings), its probable that quantitative tightening will have 2 phases. First, a liquidity phase where liquidity is drawn out of the system (evidenced by higher long-end rates) and then, a growth (declining) phase where the effect of drawing liquidity out of the system results in diminishing growth prospects that cause long-end rates to decline.
A Note on Liquidity:
It should be noted that in an effort to orchestrate a “soft-landing”, the Federal Reserve is still sitting on a tool; regulatory relief. While the Federal Reserve has hiked rates and has begun the process of winding down its treasury and agency bond purchasing program, it retains the ability to release excess liquidity that is currently trapped inside of the banking sector. Because certain regulatory restrictions on bank capital are not risk-adjusted, banks decline to participate in making markets in areas where doing so would take up a lot of balance sheet space on their books (in favor of higher profit, less capital intensive activities). Allowing banks to participate in these activities without affecting their regulatory caps would add liquidity to the marketplace, most notably the treasury market (assuming banks agree to participate). It is possible that the Federal Reserve may attempt to use regulatory reform in an effort to entice banks to disperse liquidity into financial markets to soften the blow of the tightening cycle (presumably after the Federal Reserve has achieved sufficiently tight financial conditions to quell inflation or the employment rate has significantly risen making their employment mandate relevant). Doing so has the potential to increase the magnitude and perhaps draw out the period of time over which any “relief” rally may occur.
Be On The Look-Out:
During this period there are a few important factors to be aware of:
The US Dollar: Continued strength in the US dollar poses a continued threat to risk-assets. Be aware of any trend reversal or sustained weakness in the US dollar which has the potential to give risk-assets a bid.
Short End Rates: The Federal Reserve is still engaged tightening financial conditions in an effort to reign in inflation. Short end rates will begin to price a terminal price (the price at which no further hikes are expected). Given persistently high inflation, it seems likely the terminal price (and duration for which the terminal price will be held before cuts) is too low (given it is below the Federal Reserve’s dot plot/prior “SEP” guidance). But it is quite possible that after the next Fed meeting or two, forward swap curves/futures will have appropriately priced the terminal rate. After this point any subsequent decrease in the pace or magnitude of hikes will be seen as “relief” from tightening.
Long End Rates: QT has caused the total assets of the Federal Reserve Balance Sheet to flat line, but a meaningful drawdown in assets as not yet occurred. As this begins to materialize into the fall, it could have a significant impact on treasury liquidity (and long-end prices), i.e. rates may rise on the long-end and long duration assets may suffer. Be aware, however, that (1) long-end rates are sensitive to growth prospects and will be balancing out the prospects of pricing in a growth recession as well, and (2) the Federal Reserve may seek to modulate the impact on treasury liquidity using regulatory relief.
Housing Activity and Mortgages: Further deterioration in credit seems likely as the Federal Reserve continues on its tightening path. HY spreads have continued to widen although they are still below prior extremes. HY issuance is also down significantly. Similarly, MBS and housing activity is significantly off its peaks. Continued weakness should be expected as the Federal Reserve continues tightening (and growth begins to decline). Be aware of any market dislocations that may arise from continued pressure in credit or housing. As credit and housing goes, the rest of the economy goes.
Unemployment: While inflation is center-stage, there is a point at which the unemployment rate becomes relevant again. As announcements of layoffs begin to pile up, be aware of any noticeable upticks in the unemployment rate that may indicate the Federal Reserve has gone too far in its tightening regime.
Regulatory/SLR Relief: The Federal Reserve may attempt to soften the economic landing of tightening using regulatory relief. Be aware of any discussion of adjustments to the “supplemental leverage ratio” (SLR).
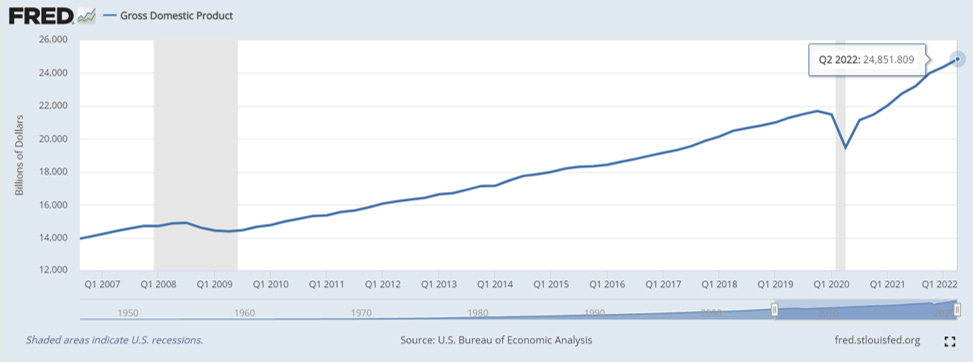
Economic Snapshot:
GDP: Q2 $24,851.089 Real GDP growth slowed at a rate of -0.9%. While this is a sign the US economy is slowing, it should be noted that nominal GDP growth continued to increase and the US unemployment rate remains at historic lows, indicating a tight labor market and a generally overheated economy.

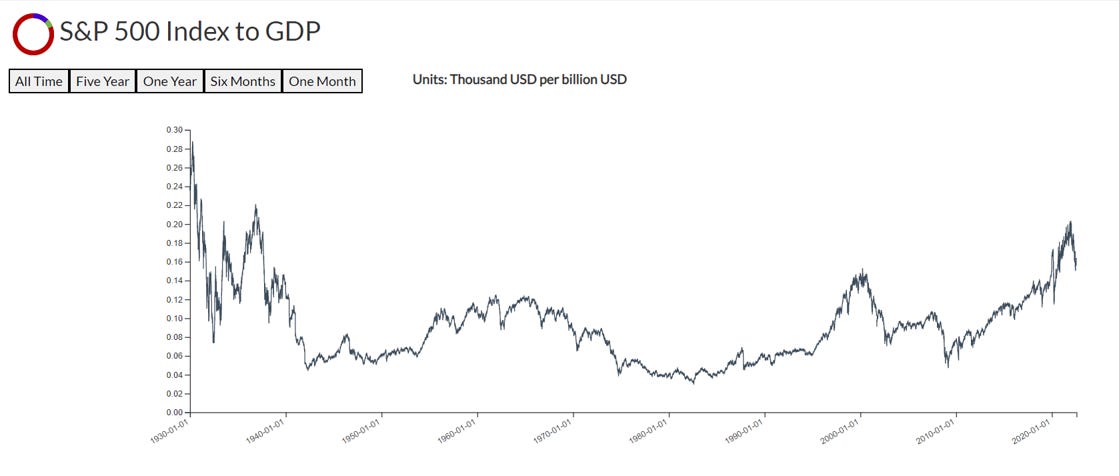
Price: Stock market averages continue to remain near all-time highs with the S&P500 closing at 4,023.61 on July 27, 2022. Although, prices are off the peak and trending down.

Price to GDP: Price to GDP ratios remain historically high with an S&P500 to GDP ratio of 0.0165 (down slightly from our April reading of 0.1743 and our January reading of 0.1847). This continues to exceed the Price to GDP ratios seen during the Dot-com bubble.
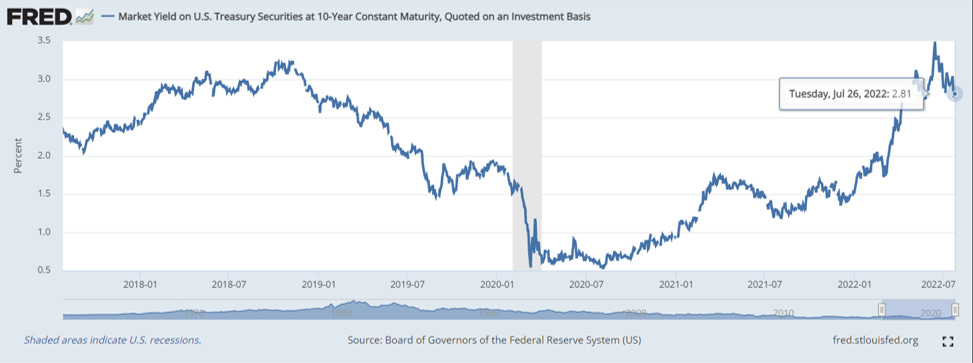
Interest Rates: The 10-Year Treasury Rate rose to has high as 3.5% (in June) before falling back to 2.81% as of July 26, 2022 (representing only a minor change from our April reading of 2.77.
Rate-adjusted Price to GDP: Rate-adjusted price to GDP has remained largely range-bound since our April reading and continues to sit just above 2018 levels.

Yield Spreads: Corporate credit yields have risen significantly. IG and BBB debt now sit at approximately there 2020 highs (mostly driven by increases in interest rates rather than credit spreads). HY debt sits just below its prior 2020 high. Notably the 3-month T-Bill and 10-year T-Note are near inversion (a harbinger for recession).

Yield-adjusted Price to GDP: Yield-adjusted Price to GDP has continued to rise. Notably, HY is at levels last seen in 2020 and IG and BBB both exceed levels seen in 2020.

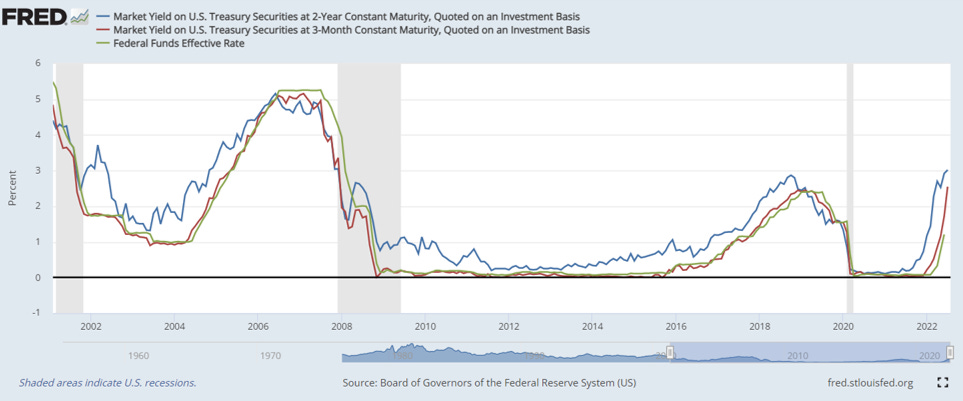
10-Year to 3-Month Treasury Spread: The 10-year to 3-month treasury spread has decreased to a mere 0.34 (down from 2.00 in April 2022), driven mostly by the accelerated speed of Federal Reserve hiking that began in June.

The 10-Year to 2-Year Treasury Spread is also deeply inverted (another harbinger of recession).

Notably, the divergence divergence between the 10-Year to 2-Year Treasury Spread, and 3-Month and 2-Year Treasuries has closed significantly (as the 3-month has caught up to the 2-Year). Historically, the 3-month, 2-year Treasuries and Federal Funds rate invert prior to the end of a hiking cycle.
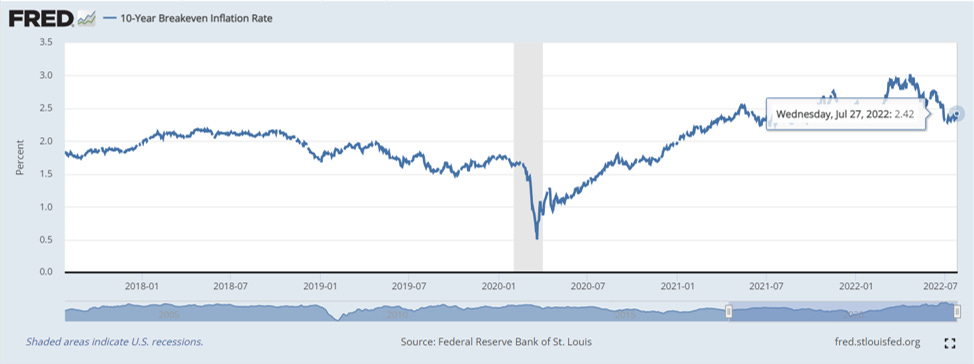
Inflation Break-Evens: Intermediate and long-run inflation averages have ticked down notably since April (when they were hovering ~3%). They have, however stabilized ~2.5% (still well above the 2% long-run inflation target of the Federal Reserve). As mentioned earlier, some volatility will likely arise from this point on, as marginal changes in financial conditions affect expectations (and the Federal Reserve adopts a “data-dependent” approach).

Housing Affordability:
30-Year Mortgage-adjusted Housing Price to Household Income: The historic unaffordability in housing that began in Q1 has continued. Notably, an estimate of average mortgage payments to average household income has stabilized above circa 2006-2008 levels (i.e. levels last seen during the 2008 housing/financial crisis).
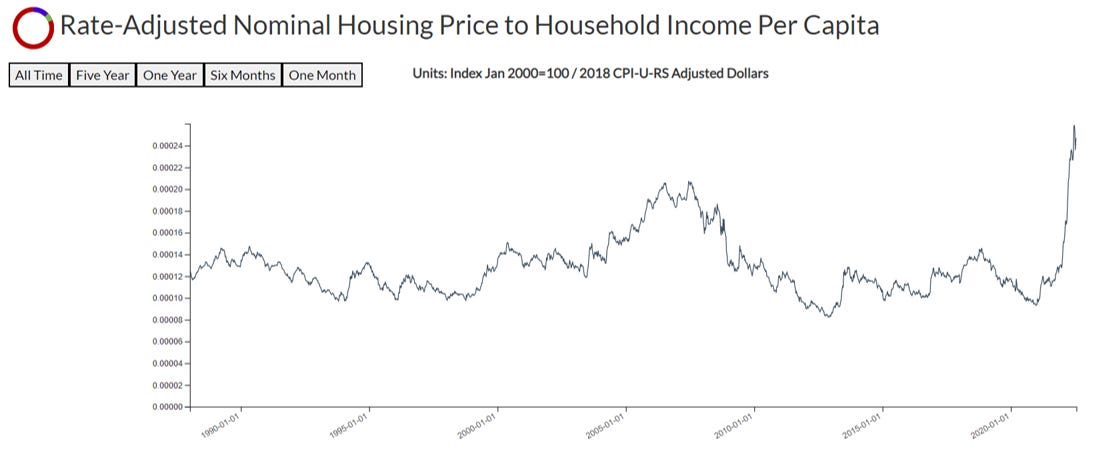
Housing Price to Household Income: Housing affordability in absolute terms of housing price to household income continues to exceed levels last seen in the 2006-2008 housing/financial crisis.

Disclaimer
The data displayed in this report was developed by DeCotiis Analytics LLC (“DeCotiis Analytics”) using various public sources. DeCotiis Analytics is NOT a registered investment adviser and does not guarantee the accuracy or completeness of the information contained herein, or any data or methodology either included herein or upon which it is based. Individual investment decisions are best made with the help of a professional investment adviser.
Although effort has been taken to provide reliable, useful information in this report, DeCotiis Analytics does not guarantee that the information is accurate, current or suitable for any particular purpose. Data contained in this report are those of DeCotiis Analytics currently and are subject to change without notice. DeCotiis Analytics makes no guarantee or warranty of the accuracy of source data or the results of compilation of such data.
The information provided herein is for informational and educational purposes only. It should not be considered financial advice. You should consult with a financial professional or other qualified professional to determine what may be best for your individual needs. DeCotiis Analytics does not make any guarantee or other promise that any results may be obtained from using the content herein. No one should make any investment decision without first consulting his or her own financial advisor and conducting his or her own research and due diligence. To the maximum extent permitted by law, DeCotiis Analytics disclaims any and all liability in the event any information, commentary, analysis, opinions, advice and/or recommendations prove to be inaccurate, incomplete, unreliable or result in any investment or other losses. Content contained or made available herein is not intended to and does not constitute investment advice and your use of the information or materials contained is at your own risk.
Information from this report may be used with proper attribution. All original text, graphs and compilations of data contained in this document are copyrighted material attributed to DeCotiis Analytics. Any reproduction or other unauthorized use of material herein is strictly prohibited without the express written permission of DeCotiis Analytics.