


Pop Goes the Weasel
As a regional banking crisis rolls through financial markets, the Federal Reserve maintains restrictiveness to combat inflation


In our last issue (Circling the Drain - January 26, 2023), we noted that, the Federal Reserve was wedged between two outcomes: Outcome #1 respond to weakness in data indicating the US economy was headed into recession but risk re-igniting inflation in an “Arthur Burns-ian” fashion; or Outcome #2 ignore weakness in forward data, holding policy rates at a high level until a suitable response was felt in the labor market, “Volcker-style”, but that such style would exacerbate risks to vulnerable portions of the market.
Of those two outcomes, we suggested Outcome #2 was most probable, given Jerome Powell’s admiration for Paul Volcker (who he regards as a hero of the Federal Reserve) and Jerome’s own statements regarding history “Restoring price stability will likely require maintaining a restrictive policy stance for some time. The historical record cautions strongly against prematurely loosening policy”.
Specifically, we suggested being on the look-out for:
Volatility: Caution being warranted for a market that had pinned the Federal Reserve policy response into a binary outcome between credit risk and inflation.
Credit Events: The potential for credit events in opaque areas of the market.
Liquidity Responses by the Central Banks: The Federal Reserve (and/or U.S. Treasury) had a number of liquidity apparatuses it was likely to deploy to deal with market disruptions and that while a one-sized fits all bail-out was probably a thing of the past, it was worth keeping an eye on Central Bank machinations for evidence of liquidity support.
Unemployment Rate: The unemployment rate continued to serve as a barometer for the Fed. A lagging but telltale sign that the economy has moved into recession.
Long-End Rates: Long-end rates were now sensitive to growth and recession and were susceptible to repricing.
Short-End Rates: As previously noted, the 2-year treasury had inverted the 3-month treasury and policy rate, which tends to occur before recession and before a rate-cutting cycle. (But we noted the Federal Reserve could choose to maintain this inversion for some time (as it did in 1994) in an effort to wrangle inflation.)
As the months have progressed, we have seen these observations unfold in real time (in a rather dramatic fashion), with the exception perhaps of volatility (although we’ll explain why in a moment):
First, on March 8th, a proposed capital raise in common stock, triggered a bank run on Silicon Valley Bank (SVB) (a known “relationship” bank notorious for poor management/risk controls, including but not limited to, failing to have a Chief Risk Officer of any kind for more than 9 months, a policy of having covenants in loan documents requiring all deposits of the borrower be kept at the bank in exchange for favorable loan terms and other generalized questionable loan-book credit quality). Depositors (mostly VCs and start-ups) fled the bank in response to news of capital raises to shore up it’s balance sheet. This destabilized the depositary base of the bank resulting in catastrophic failure.
This event set off a media frenzy in which market participants (mostly high profile VCs, demanded a Federally orchestrated bailout of the bank). Timeline of SVB Collapse
Second, rather than bailout the banking industry, the Federal Reserve/Treasury took two actions: (1) they fully backed stopped uninsured deposits of SVB in response to public outcry in coordination with the US Treasury (although they refused to do the same for any subsequent banks that failed or experienced stress), and (2) they instituted a new (limited and targeted) liquidity facility, called the Bank Term Funding Program (BTFP), through which a bank with certain qualifying collateral (mainly Treasuries or agency-mortgage backed securities) could borrow from the Federal Reserve at par, even if such assets were in actuality marked at a loss on the bank’s balance sheet.
The effect of the BTFP, in short, is that if the yield curve is inverted, assets that would otherwise be in a loss position (because of the change in rates) are treated by the Fed as if they are still fully valued at their purchase price (that is to say, you can borrow against them from the Fed at full value, thereby recapitalizing your bank for a period of 1-year).
Said another way, the Federal Reserve basically removed “duration risk” or “rate risk” from banks (the primary type of risk any bank takes, since they borrow short to lend long), by way of federal back-stop facility.
Third, the occurrence of a large bank failure introduced significant volatility into the market, which was quickly suppressed by the Federal Reserve/US Treasury. That is to say, the introduction of the BTFP, was at it’s creation, liquidity additive to the financial system (the Federal Reserve balance sheet expanded to create the facility and added liquidity to the system that otherwise didn’t previously exist). This caused a rise in financial assets, but the effect of the impulse was fairly small and targeted. Volatility was more suppressed/delayed than removed from the system, which is evidenced by rolling failures in related and tangential markets that continues to be ongoing.
Fourth, having “stabilized” the banking system via targeted liquidity facility, the Federal Reserve continued to hike the policy rate 25 bps in an effort to fight “sticky” inflation that has embedded in wages as well as an unemployment rate that has remained historically low (although it is starting to tick up).
Fifth, the long end of the treasury curve declined (as expected) as recession fears set in.
Sixth, the short end of the curve is now significantly inverted (a harbinger of future recession).
Pop Goes the Weasel…
As liquidity has been drawn out of the system (via Quantitative Tightening or QT), the “weasels” of the system have begun to be exposed; mainly folks who were taking poor credit risk into markets with questionable economics. This caused the Federal Reserve to temporarily retreat on it’s balance sheet reduction (notably a rapid uptick occurred in balance sheet assets in response to the creation of the new Fed facility, thereby undoing a lot of the Fed’s Quantitative Tightening program, before the Fed promptly resumed QT again, as you can see from the chart below).
It’s noticeable, however, that while doing so temporarily quelled the volatility that resulted from SVB’s failure, the process of QT is still ongoing as is the Fed’s fight against inflation. Essentially, the “patch” to the system permitted the Federal Reserve to maintain it’s course of tighter policy, and up until now, the US Treasury/Federal Reserve has declined further intervention in failed banks, choosing instead to permit their windup by the FDIC. First Republic Bank Failure Notice

This process of rolling bank failure causes risk in two ways:
(1) The risk of bank failures in regional banks (which were otherwise exempted from Dodd-Frank risk requirements because of their size) now makes them vulnerable to deposit flight (since a reasonable depositor now recognizing the stability risks in their regional bank would logically withdraw funds and send such funds to a large financial institution (GSIB) subject to Dodd-Frank). This creates a risk across the regional and community banking system of additional failures.
(2) Small and regional banks (and non-bank financial institutions like private credit funds) were functionally standing in for GSIBs and lending into markets at terms that the GSIBs themselves could not following Dodd-Frank. As a result of these failures, banks will likely pull back on credit extension into those markets (mainly VC/start-up ecosystem, commercial real estate and non-bank lending) or at a minimum refuse to lend on such “friendly/relational” terms as they were in the past.
“Credit” is a form of “money” in the sense that a loan creates purchasing power. As lending standards increase/restrict and lenders refuse to lend on favorable terms, this is functionally a “tightening” of liquidity. When liquidity tightens out of systems (particularly systems like VC/startups that are highly reliant on additional infusions of liquidity for growth), it slows growth rates and increases default risk. This is most noticeable in 2 markets:
(a) Commercial Real Estate: Small banks hold a disproportionate amount of CRE loans relative to their GSIB counterparts. CRE (particularly office space) is also undergoing the combined structural stress of decreased office use (from COVID which caused a behavioral change) and the cyclical stress of higher interest rates (many CRE loans were improperly hedged or their hedges roll off at a time where they now need to be refinanced at a higher rate).
““Compared to big banks, small banks hold 4.4-times more exposure to U.S. [CRE] loans than their larger peers,” stated a new analysts report from JPMorgan Private Bank. “Within that cohort of small banks, CRE loans make up 28.7% of assets, compared with only 6.5% at big banks,” the report continued. “More worrying, a significant percentage of those loans will require refinancing in the coming years, exacerbating difficulties for borrowers in a rising rate environment.”” For US regional banks, commercial real estate is seen as next big worry
This significantly increases default risk in the space.
(b) Non-Bank Lending: Similar to small and regional banks, “non-bank financial institutions” came to take up a disproportionately large size of the lending market (by effectively extending loans into areas of credit that GSIBs no longer found attractive given their risk requirements post-Dodd-Frank). Nonbank financial intermediaries, including pension funds, insurers, and hedge funds, that were starved for yield in the zero-interest-rate-policy era (ZIRP) began purchasing various structured credit products, bonds and even conducted direct lending. It’s estimated 50% of global financial assets now exist outside of the traditional banking system. IMF
Nonbank financial intermediaries, however, rely on the traditional banking system for certain facilities (warehouse facilities to package secured products, commitment facilities to smooth operational and investment expenses from calling commitments, etc.). As credit restricts, it exposes these structures, many of which take the form of a “fund” structure, with “Limited Partners” or “LPs” sitting on one side and investments sitting on the other (managed in the middle by a “General Partner” or “GP”). If a LP becomes uncomfortable with losses and desires to withdraw from a fund or “redeem” their LP interests in the fund, they may find themselves in a situation where they can’t get out. Either because they are “gated” into the fund (by the rights of the GP in the fund documentation to limit redemptions to prevent destabilizing the fund) or because the underlying assets are illiquid and can’t be sold in sufficient size in the market to generate the proceeds needed to return capital to the LP. This has the risk of causing “redemption” spirals and panic. (Nothing causes panic quite like asking to sell out of a position and being told you cannot).
We have already seen echoes of this risk in some early fund stress. Blackstone’s real estate trust (BREIT) has already gated investors. Blackstone's BREIT and other funds curb investor redemptions
Similarly, in recent months, Apollo pitched some institutional investors on recycling capital from an old fund into a new fund, to ease an industry wide fundraising slump, as LPs begin to reassess credit risk (the investors promptly balked at the suggestion). Apollo pitches investors on deal to ease fundraising slump
It’s also noticeable that many large PE shops have also prepared an “offensive strategy” against the environment by raising large “LP secondaries” funds, with the ostensible desire to purchase LP interests from fleeing LPs at distressed prices (presumably in some anticipated crisis, perhaps even cannibalizing the interests’ of their own clients). Blackstone strategic partners closes record private equity secondary funds at 25-billion
Financial Market Uncertainty
The combined effect of rolling bank failures on top of risky (and in some cases unregulated) lending markets is that the credit bubble has effectively already been “popped” and air is leaking out of the tires of the financial system.
Much like a tire in a car, a leaky tire can last a awhile, but if you continue to drive on it, it increases the risk the entire tire “pops” with time.
Adding further risk is the fact that the Federal Reserve has effectively slapped a patch over the hole in the tire the Fed feels responsible for (mainly the traditional banking system) and is continuing to drive on it, despite the fact air is still leaking through other holes in the tire.
This creates a serious risk to the system, where while many think the problem is solved and the system can “return to normal”, there is a significant risk that a fragile component of the market begins to break instilling “fear” in the system.


Be On The Look-Out:
This is a period of heightened risk in financial markets and as a result there are a few important factors to be aware of:
1) Unemployment: The unemployment rate may begin to respond over the next quarter to the Federal Reserve’s tightening policy. The response of unemployment to tightening Fed policy tends not to be linear or gradual (it’s typically a gradually, then suddenly situation).
2) Credit Events and Market Dislocations: As discussed in more detail above, now that the proverbial bubble in credit has been punctured by regional banking failures, the tide of credit may begin to restrict. As the tide goes out, it begins to expose those who have been “swimming naked” all along. As this occurs, credit may experience stress (which may be reflected in spreads) and liquidity issues may surface.
3) Growth expectations: The business cycle is indelibly linked to the credit cycle. As the tide of credit recedes be on the look out for decreasing growth across markets.
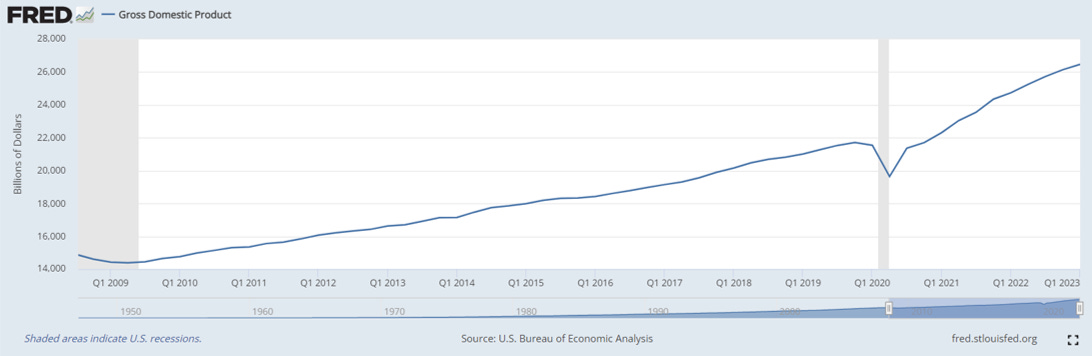
Economic Snapshot:
GDP: 26,465.865 (Q1 2023) GDP growth was positive in Q1.
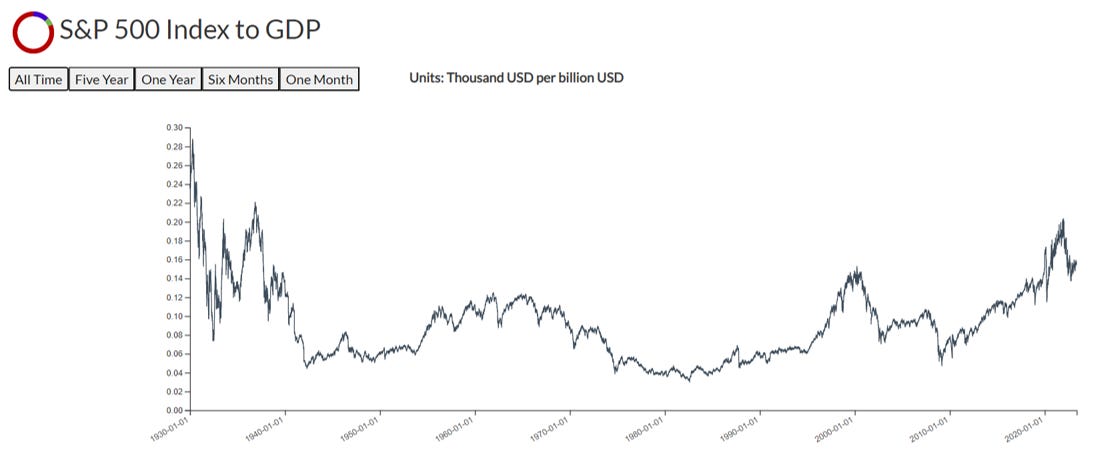
Price: S&P500 closed at 4,130.62 on May 11, 2023.

Price to GDP: Price to GDP ratios remain historically high with an S&P500 to GDP ratio of 0.1563 (largely flat from our January reading). This continues to exceed the Price to GDP ratios seen during the Dot-com bubble.
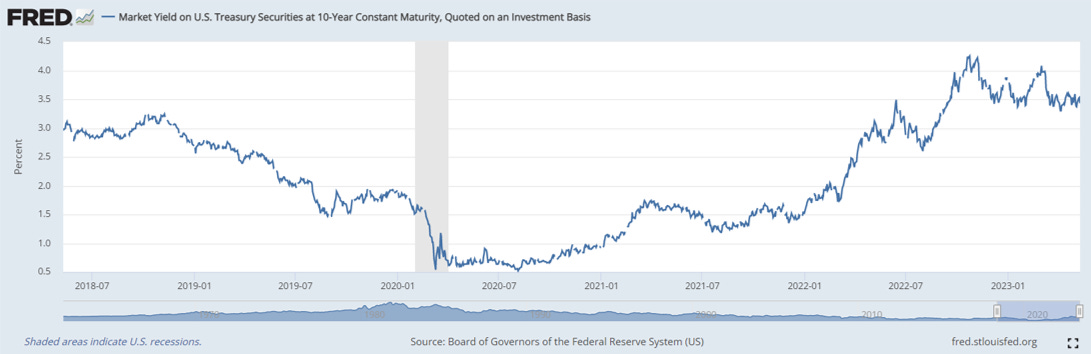
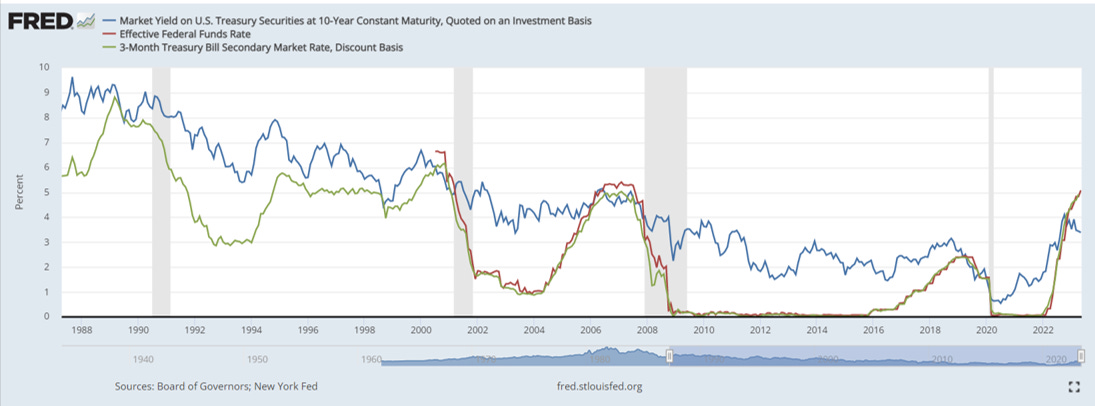
Interest Rates: The 10-Year Treasury Rate remains range bound at around 3.43%.
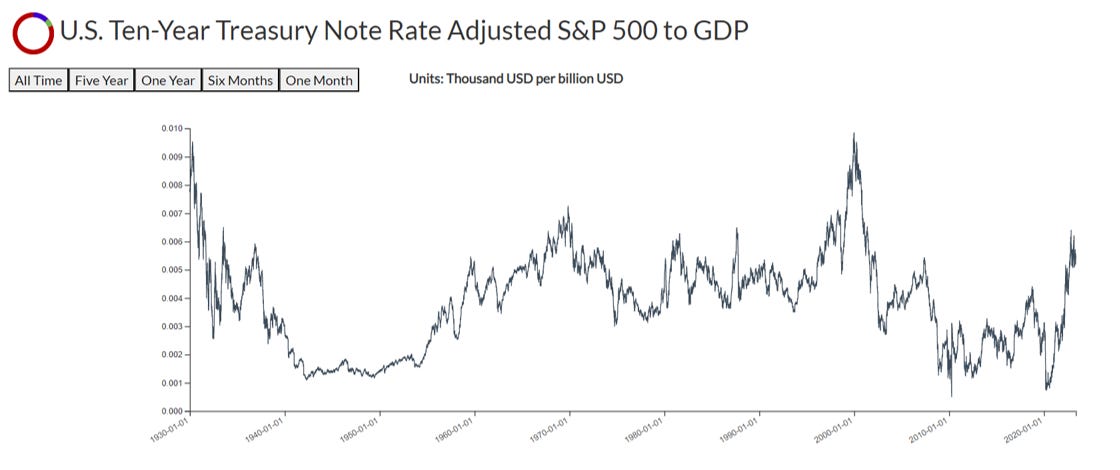
Rate-adjusted Price to GDP: Rate-adjusted price to GDP continues to sit just above 2018 levels.
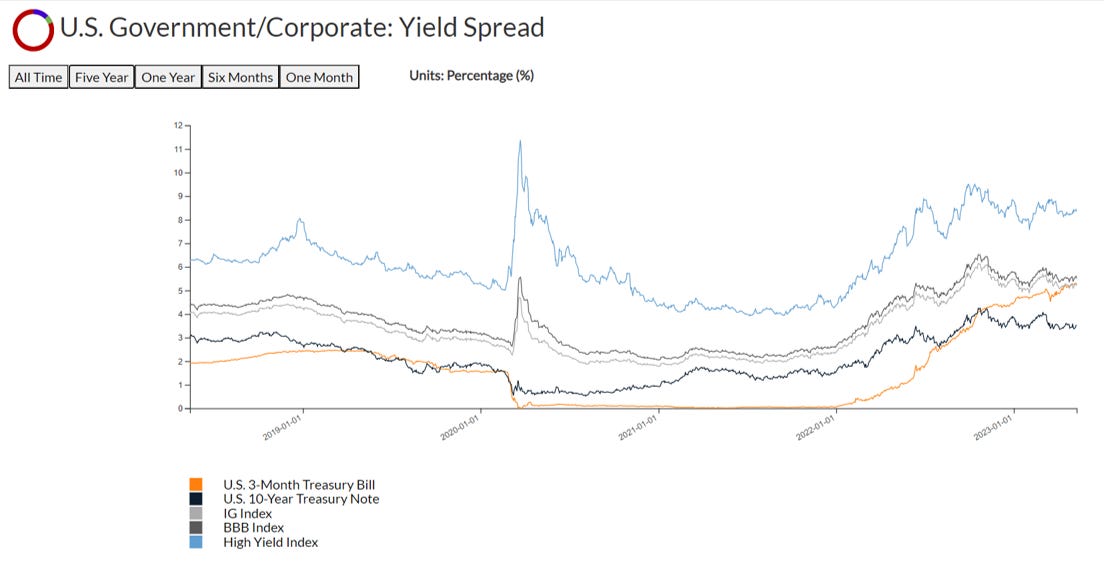
Yield Spreads: The 3-month T-Bill and 10-year T-Note have now severely inverted (a harbinger for recession). Notably, the 3-month T-Bill has risen so dramatically it threatens the yield on the investment grade index (which is frankly very strange, given the difference in credit profiles and representative of how aggressive the Fed’s hiking cycle has become).
Yield-adjusted Price to GDP: Yield-adjusted Price to GDP has risen to levels last seen in 2008.

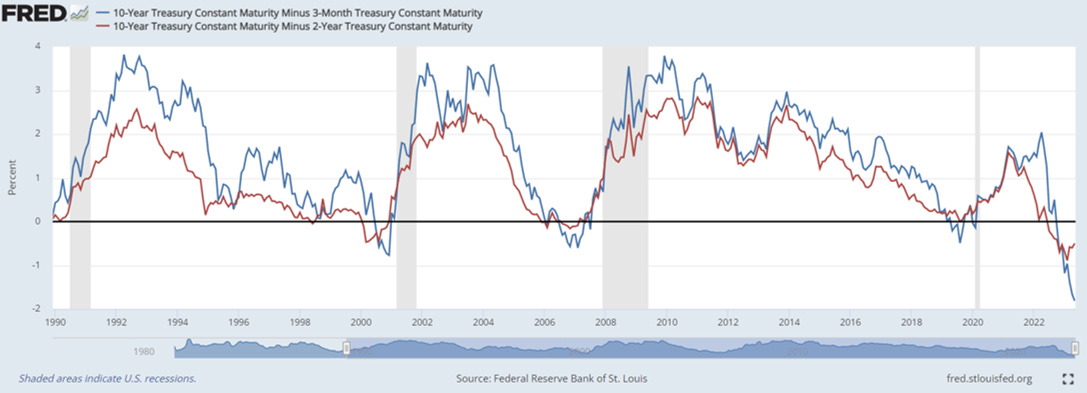
10-Year to 3-Month Treasury Spread: The 10-year to 3-month Treasury Spread and the 10-Year to 2-Year Treasury Spread are deeply inverted (another harbinger of recession).
Disclaimer
The data displayed in this report was developed by DeCotiis Analytics LLC (“DeCotiis Analytics”) using various public sources. DeCotiis Analytics is NOT a registered investment adviser and does not guarantee the accuracy or completeness of the information contained herein, or any data or methodology either included herein or upon which it is based. Individual investment decisions are best made with the help of a professional investment adviser.
Although effort has been taken to provide reliable, useful information in this report, DeCotiis Analytics does not guarantee that the information is accurate, current or suitable for any particular purpose. Data contained in this report are those of DeCotiis Analytics currently and are subject to change without notice. DeCotiis Analytics makes no guarantee or warranty of the accuracy of source data or the results of compilation of such data.
The information provided herein is for informational and educational purposes only. It should not be considered financial advice. You should consult with a financial professional or other qualified professional to determine what may be best for your individual needs. DeCotiis Analytics does not make any guarantee or other promise that any results may be obtained from using the content herein. No one should make any investment decision without first consulting his or her own financial advisor and conducting his or her own research and due diligence. To the maximum extent permitted by law, DeCotiis Analytics disclaims any and all liability in the event any information, commentary, analysis, opinions, advice and/or recommendations prove to be inaccurate, incomplete, unreliable or result in any investment or other losses. Content contained or made available herein is not intended to and does not constitute investment advice and your use of the information or materials contained is at your own risk.
Information from this report may be used with proper attribution. All original text, graphs and compilations of data contained in this document are copyrighted material attributed to DeCotiis Analytics. Any reproduction or other unauthorized use of material herein is strictly prohibited without the express written permission of DeCotiis Analytics.