


Circling The Drain
Having now pulled the plug on Fed liquidity, market participants await direction from the Federal Reserve on whether they intend to stop the drain or allow the economy to spiral into recession


In our last issue (Pulling The Plug - October 27, 2022), we noted that, while a fair bit of time had passed, we were still likely only in the early stages of repricing, e.g. most repricing had been a function of liquidity reduction and resulting multiple compression. We also noted that the Federal Reserve was stuck between its three mandates: inflation, financial stability, and unemployment (the unemployment mandate having completely fallen away in the face of inflation to actually making causing unemployment the goal). We further noted that a “recession” (whether deep or shallow) had not yet been priced and that ultimately, the severity of damage caused to global growth would determine the ultimate equilibrium price at which the global economy (and therefore asset prices) will ultimately reset. Effectively, we noted that the Fed was in the process of pulling the liquidity “plug” on the riskier sectors of the market (within a realm of reason, where the Fed stood at the ready with various tools to intervene if necessary), but neither credit nor earnings had been meaningfully impacted yet. More specifically, we noted:
Credit Events Internationally: The global pension and insurance system contains within it hidden embedded leverage that could trigger periodic credit/liquidity crises.
Credit Events Domestically: The US (particularly in the pension/insurance area and private markets) was also at risk of shocks.
Liquidity Responses by Foreign Central Banks: To look out for signs foreign policy was diverging considerably from US domestic policy as this would exacerbate cross-currency and foreign funding issues.
Liquidity Responses by the Federal Reserve/U.S. Treasury: To look out for signs the Federal Reserve (or U.S. Treasury) was preparing to deploy or deploying liquidity apparatuses as this would/will have a powerful impact on asset prices.
Unemployment Rate: The Federal Reserve was using the Unemployment Rate as a barometer of the relative health/tightness of the labor market. We also noted that at this point growth concerns would take over from liquidity concerns as a recession begins to be priced into the market.
Long-End Rates: We noted that as treasury market liquidity continued to dry up rates might rise on the long-end and long duration assets may suffer, but to be aware that long-end rates were sensitive to growth prospects and would begin balancing out the prospects of pricing in a growth recession as well.
Short-End Rates: We noted that as growth began to roll-over, the short-end of the treasury market would begin to price a recession. This relative “easing” of financial conditions from this reaction function would be challenging for the Federal Reserve who may very well respond by “overtightening”, i.e. by staying tighter for longer to ensure inflation is under control. This would/will be damaging to the real economy. We finally noted to be aware that the 2-year treasury will typically invert the 3-month treasury and policy rate (even if the Federal Reserve is holding the policy rate steady) prior to the commencement of a recession (and rate cutting cycle).
As the months have progressed, we have seen these observations unfold in real time:
First, as the Fed pulled the liquidity “plug” on the marketplace riskier sectors of the market have begun to deteriorate internationally and domestically. Notably, the cryptocurrency exchange darling, FTX was revealed to have been comingling client and corporate funds resulting in insolvency (and general scandal). FTX - Business Insider Additionally, high profile REITS have begun gating clients and scrambling for liquidity as they struggle to meet investor redemptions against an illiquid pool of assets which are not easily liquidated. KKR and Starwood Limit Withdrawals - Barrons; Gates come down on Blackstone REIT - SP Global
While no specific “credit event” has occurred. Certain more opaque areas of the market have begun to show early signs of distress Credit quality declines for european leveraged loans amid ratings shift - Pitchbook and credit downgrades seem likely. Leveraged Loan downgrade wave is starting as era of cheap debt fades - Marketwatch
Second, foreign central bank policy diverged significantly from US domestic central bank policy over the period, with Australia, Canada and the BoE all failing to keep pace with the US pace of the hiking cycle. This has led to a resurgence of inflation in some of these areas (mainly Australia and Canada), both of whom are caught between large real estate bubbles and the need to quash inflation. Australian inflation hits 33-year high on energy costs and tourism rebound; 22% of Canadians say they’re ‘completely out of money’ as inflation bites: poll
Notably, an attempt by the BoJ to allow a wider band of movement in yields (a step toward removing YCC) jolted markets forcing the BoJ to increase monetary easing. BOJ YCC change jolts market - CNN The effect of this is the BoJ now owns 50% of its own government debt and has a completely dysfunctional government bond market which it will need to attempt to phase out over time. New BOJ Chief Likely to start to phase out YCC Ex-Official Says - Bloomberg
Fourth, neither the Fed nor US Treasury has not as of yet made any major machinations to deal with Treasury market liquidity, although the US Treasury continues to toy with the idea of a Treasury buyback to improve liquidity. Fewer Treasury Bills Liquidity Questions What to Expect of US Refunding
Fifth, despite large layoffs in the technology sector, the US labor market has remained remarkably tight. In fact the unemployment rate continues to decline despite efforts by the Federal Reserve to tighten conditions such that wage growth declines back to trendline growth. GDP was also positive over the period.
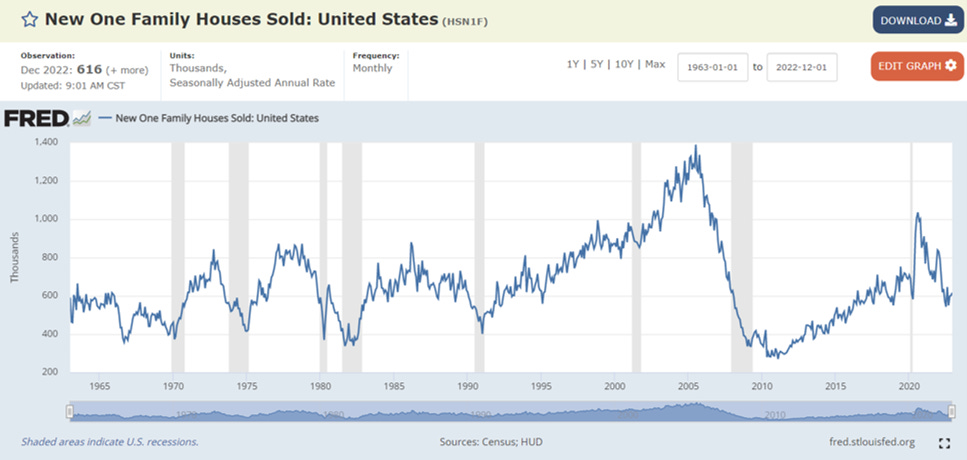
Sixth, despite signs of strength from the US labor market and GDP readings, the long-end of the treasury market has begun to react to leading indications growth is deteriorating (mainly housing units sold and PMI’s both of which have breached recessionary levels).
Seventh, as expected the 2-year Treasury inverted the Federal Funds rate (and likely will further invert following the Fed’s next meeting).

The Fed also reiterated a “higher for longer” stance noting that history warns against the risk of loosening “too soon” in the fight against inflation. Fed Policy Makers See Interest Rates Higher for Longer - Reuters It seems likely the Fed will reiterate this stance once again at its next meeting.
Circling the Drain…
The Federal Reserve is now in the unenviable position of being stuck between leading and lagging data. To begin, forward indicators of growth are deteriorating rapidly.
US PMI is reading below 48 which historically is indicative of recession:

Single family houses sold has also deteriorated rapidly and is now below 2020 levels:
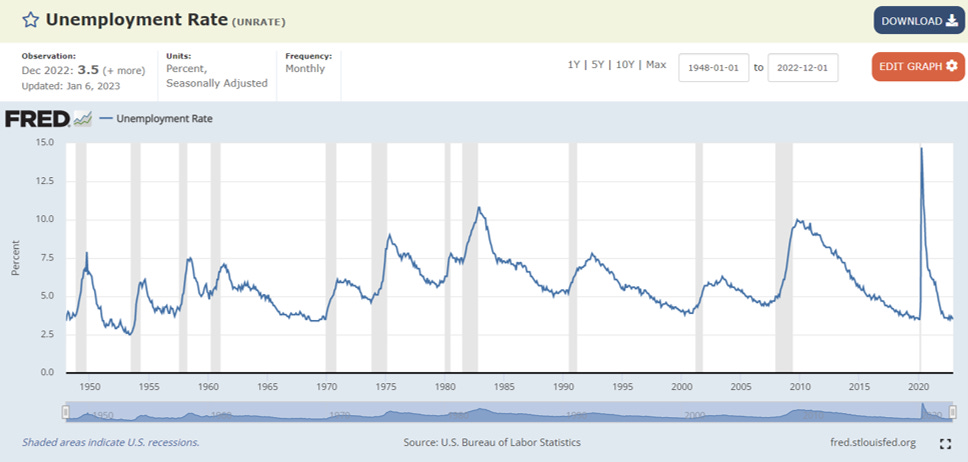
In spite of these forward indicators of growth deterioration and pending recession, lagging indicators are remaining remarkably resilient. Notably the unemployment rate is at all time lows and is essentially non-responsive to Fed tightening as of yet:
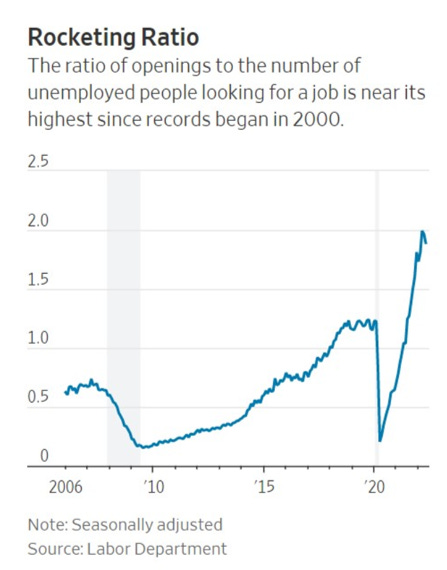
JOLTS data is similarly remarkably strong. There are roughly two jobs (really 1.7) for every one unemployed worker looking for work:
GDP aas noted above also came in positive over the period at +2.9% GDP - BEA on the back of stronger than expected consumer spending in Q4. GDP Growth Inflation - NY Times .
The result of this conflicting data is that market participants are caught between two worlds. Many market participants believe we are already in recession and that Fed cuts are imminent (the Fed Funds Futures curve has in fact priced in rapid cuts and the yields on the long-end of the Treasury curve have declined), but the data the Federal Reserve is most concerned with (mainly wage data) has failed to materially weaken such that the Federal Reserve can actually cut rates or guide down to a lower terminal rate (which the Fed is currently targeting in the ~5%) range and GDP is actually positive.
This sets up two primary outcomes:
Outcome #1: The Federal Reserve responds to weakness in data indicating the US economy is headed into recession (further slowing the pace of hikes, guiding to a lower terminal, or cutting rates). Doing so (without awaiting a response from wage data) would likely re-ignite inflation in an “Arthur Burns-ian” fashion. That is to say, inflation is reflexive and any associated easing in financial conditions is likely to reignite it into an analogous stop-go policy of the 70s. In fact, simply slowing the pace of hikes, has already caused such an effect (albeit of smaller magnitude), as financial conditions have loosened over the last few weeks and commodities have begun to reassert themselves against a weaker dollar.
Outcome #2: The Federal Reserve ignores weakness in forward data and holds the policy rate at a high level until a suitable response is felt in the labor market. This would likely have the effect of regaining control over inflation “Volcker-style”, but would also exacerbate risks to vulnerable portions of the market (real estate, credit, etc.).
Of these two outcomes, Outcome #2, remains most probable in the opinion of the author, given Jerome Powell’s admiration for Paul Volcker (who he regards as a hero of the Federal Reserve) and Jerome’s own statements regarding history “Restoring price stability will likely require maintaining a restrictive policy stance for some time. The historical record cautions strongly against prematurely loosening policy”.
This outcome has a high likelihood of driving the economy into a deep recession and causing deep economic scarring. It also has the potential to cause significant upheaval in financial markets.
Financial Market Uncertainty
Financial markets reflect the uncertainty surrounding Fed policy. Using the S&P as a proxy for broader conditions, equity markets have consolidated into a very tight range over the preceding months (what one might consider an equilibrium point awaiting new direction) wedged in-between what our “prototypical bubble graph” would consider the “new normal” and the “fear” stage as it awaits further guidance from Jerome Powell:


Be On The Look-Out:
During this period there are a few important factors to be aware of:
Volatility: Periods of extreme consolidation are typically followed by explosive moves in volatility. Caution is warranted as the market has essentially cornered the Fed into a game of chicken where outcomes are binary.
Credit Events: As growth continues to deteriorate, credit events (particularly in more opaque areas of the market) increase in likelihood. An increase in downgrades are an early warning sign of future distress.
Liquidity Responses by the Central Banks: As mentioned in prior newsletters, the Federal Reserve (and/or U.S. Treasury) has a number of liquidity apparatuses it can deploy to deal with market disruptions. Naturally, a disruption needs to occur for this to become relevant, but the one-sized fits all bail-out is probably a thing of the past and it’s worth keeping an eye on Central Bank machinations for evidence of liquidity support.
Unemployment Rate: JOLTS data and the unemployment rate continue to serve as a barometer for the Fed. A lagging but telltale sign that the economy has moved into recession is a meaningful uptick in the unemployment rate (e.g. Sahm Rule: the start of a recession occurs when the three-month moving average of the unemployment rate rises by 0.50 percentage points or more relative to its low during the previous 12 months). As of now the unemployment rate hasn’t ticked up at all.
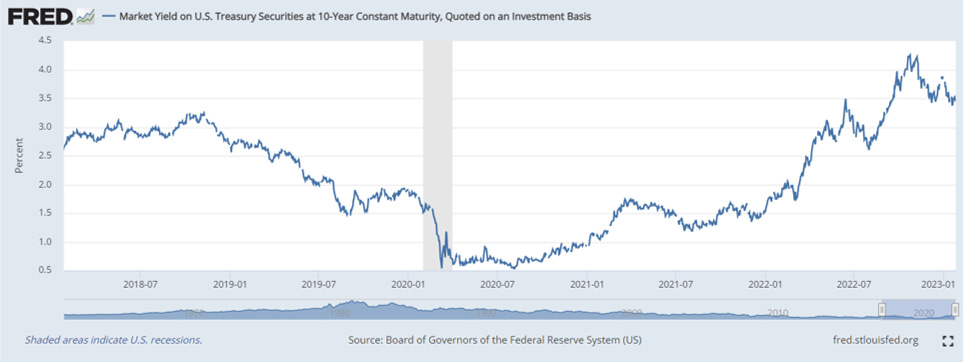
Long-End Rates: Long-end rates are now sensitive to growth and recession. As noted above, pricing in a recession when GDP is positive and the unemployment rate is at an all-time low appears pre-mature and may likely catch long-end treasury traders offsides. As growth deterioration takes over, however, long-end treasuries becomes a common and likely recession trade.
Short-End Rates: As previously noted, the 2-year treasury has inverted the 3-month treasury and policy rate. This tends to occur before recession and before a rate-cutting cycle. However, be aware that the Federal Reserve can maintain this inversion for some time (as it did in 1994) in an effort to wrangle inflation.
Economic Snapshot:
GDP: 26,132.458 (Q4 2022) Real GDP growth accelerated at a rate of 2.9%.

Price: S&P500 closed at 4,060.42 on January 26, 2023.
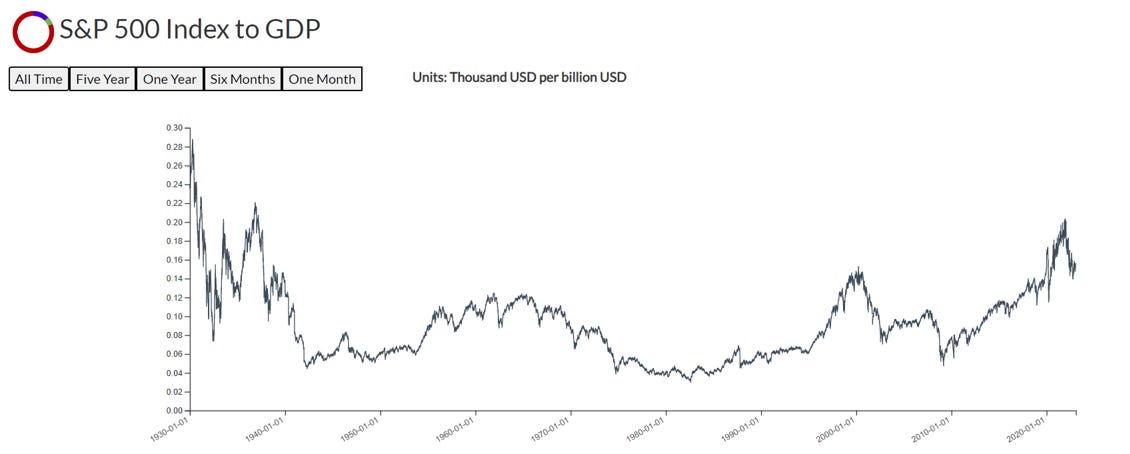
Price to GDP: Price to GDP ratios remain historically high with an S&P500 to GDP ratio of 0.1561 (up slightly from our October reading). This continues to exceed the Price to GDP ratios seen during the Dot-com bubble.
Interest Rates: The 10-Year Treasury Rate remains around 3.502%.
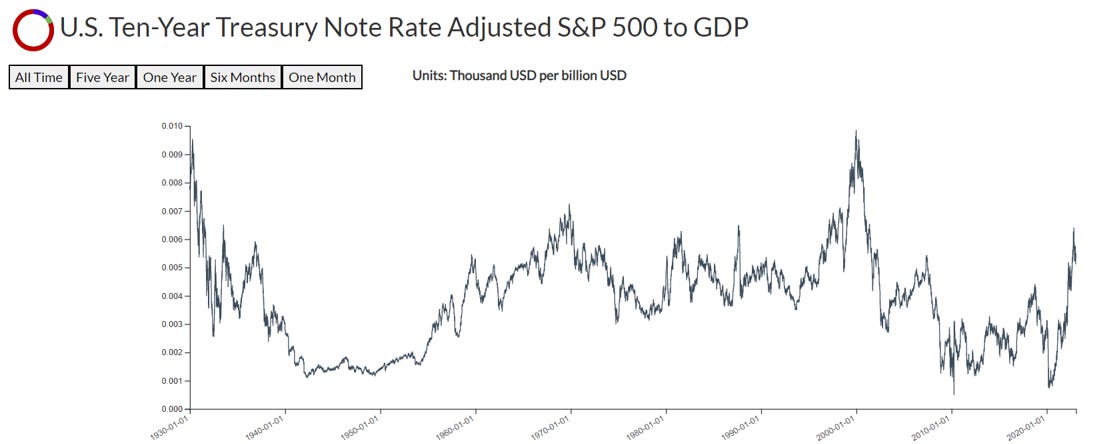
Rate-adjusted Price to GDP: Rate-adjusted price to GDP continues to sit just above 2018 levels.
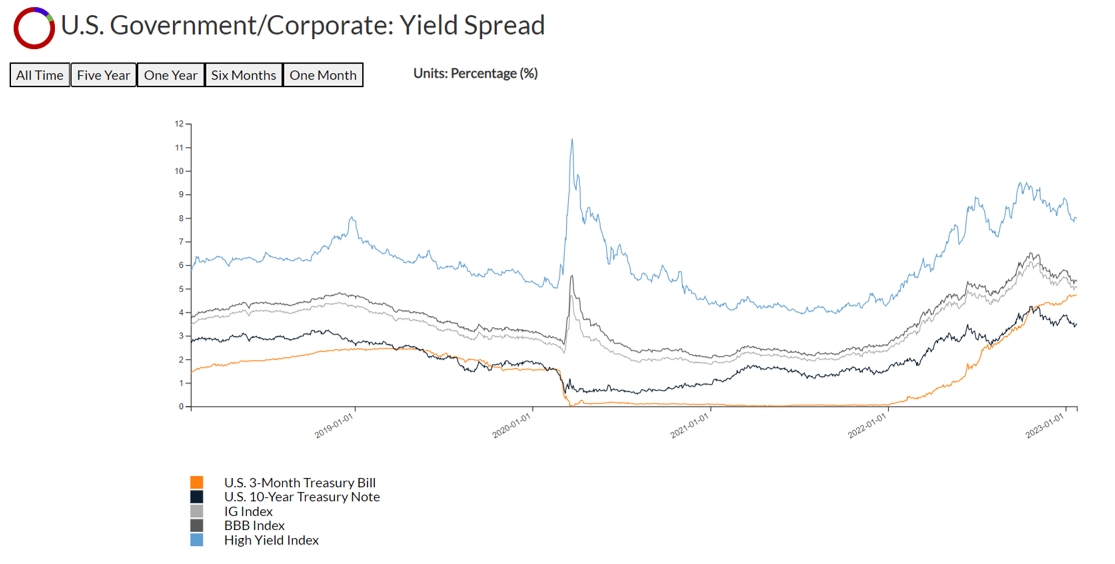
Yield Spreads: Notably the 3-month T-Bill and 10-year T-Note have now severely inverted (a harbinger for recession).
Yield-adjusted Price to GDP: Yield-adjusted Price to GDP continues to remain at or above levels last seen in 2020.

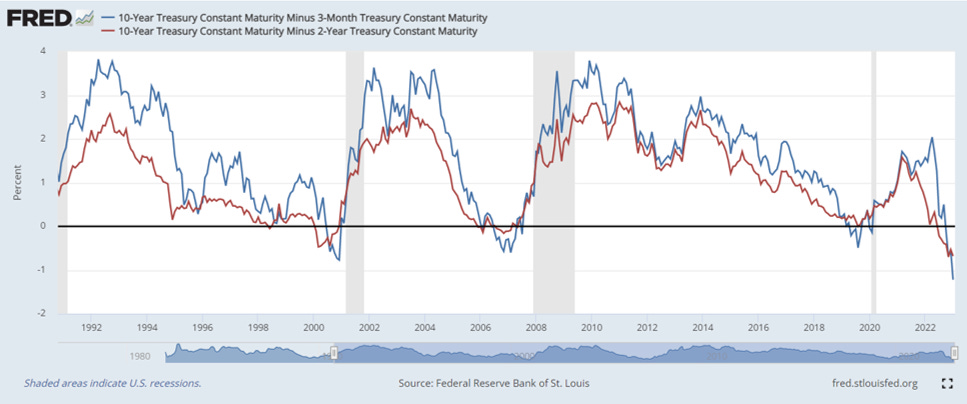
10-Year to 3-Month Treasury Spread: The 10-year to 3-month Treasury Spread and the 10-Year to 2-Year Treasury Spread are deeply inverted (another harbinger of recession).

Disclaimer
The data displayed in this report was developed by DeCotiis Analytics LLC (“DeCotiis Analytics”) using various public sources. DeCotiis Analytics is NOT a registered investment adviser and does not guarantee the accuracy or completeness of the information contained herein, or any data or methodology either included herein or upon which it is based. Individual investment decisions are best made with the help of a professional investment adviser.
Although effort has been taken to provide reliable, useful information in this report, DeCotiis Analytics does not guarantee that the information is accurate, current or suitable for any particular purpose. Data contained in this report are those of DeCotiis Analytics currently and are subject to change without notice. DeCotiis Analytics makes no guarantee or warranty of the accuracy of source data or the results of compilation of such data.
The information provided herein is for informational and educational purposes only. It should not be considered financial advice. You should consult with a financial professional or other qualified professional to determine what may be best for your individual needs. DeCotiis Analytics does not make any guarantee or other promise that any results may be obtained from using the content herein. No one should make any investment decision without first consulting his or her own financial advisor and conducting his or her own research and due diligence. To the maximum extent permitted by law, DeCotiis Analytics disclaims any and all liability in the event any information, commentary, analysis, opinions, advice and/or recommendations prove to be inaccurate, incomplete, unreliable or result in any investment or other losses. Content contained or made available herein is not intended to and does not constitute investment advice and your use of the information or materials contained is at your own risk.
Information from this report may be used with proper attribution. All original text, graphs and compilations of data contained in this document are copyrighted material attributed to DeCotiis Analytics. Any reproduction or other unauthorized use of material herein is strictly prohibited without the express written permission of DeCotiis Analytics.